watch: Housing Market Update (July 2017) 


BC Real Estate Association (BCREA) Economist Brendon Ogmundson discusses the June 2017 statistics.
BC Real Estate Association (BCREA) Economist Brendon Ogmundson discusses the June 2017 statistics.
Home buyer activity returned to near record levels across the Metro Vancouver housing market in May.
Residential property sales in the region totalled 4,364 in May 2017, a decrease of 8.5 per cent from the 4,769 sales in May 2016, an all-time record, and an increase of 22.8 per cent compared to April 2017 when 3,553 homes sold.
Last month’s sales were 23.7 per cent above the 10-year May sales average and is the third-highest selling May on record.
“Demand for condominiums and townhomes is driving today’s activity,” Jill Oudil, Real Estate Board of Greater Vancouver (REBGV) president said. “First-time buyers and people looking to downsize from their single-family homes are both competing for these two types of housing.”
New listings for detached, attached and apartment properties in Metro Vancouver totalled 6,044 in May 2017. This represents a 3.9 per cent decrease compared to the 6,289 units listed in May 2016 and a 23.2 per cent increase compared to April 2017 when 4,907 homes were listed.
The month-over-month increase in new listings was led by detached homes at 27.1 per cent, followed by apartments at 22.7 per cent and townhomes at 14.1 per cent.
The total number of properties currently listed for sale on the MLS® system in Metro Vancouver is 8,168, a 5.7 per cent increase compared to May 2016 (7,726) and a 4.5 per cent increase compared to April 2017 (7,813).
“Home buyers are beginning to have more selection to choose from in the detached market, but the number of condominiums for sale continues to decline,” Oudil said.
The sales-to-active listings ratio across all residential categories is 53.4 per cent. By property type, the ratio is 31 per cent for detached homes, 76.1 per cent for townhomes, and 94.6 per cent for condominiums.
Generally, analysts say that downward pressure on home prices occurs when the ratio dips below the 12 per cent mark for a sustained period, while home prices often experience upward pressure when it surpasses 20 per cent over several months.
“While sales are inching closer to the record-breaking pace of 2016, the market itself looks different. Sales last year were driven by demand for single-family homes. This year, it’s clear that townhomes and condominiums are leading the way,” said Oudil. “It’s important to work with your local REALTOR® to understand the different factors affecting the market today.”
The MLS® Home Price Index composite benchmark price for all residential properties in Metro Vancouver is currently $967,500. This represents an 8.8 per cent increase over May 2016 and a 2.8 per cent increase compared to April 2017.
Sales of detached properties in May 2017 reached 1,548, a decrease of 17 per cent from the 1,865 detached sales recorded in May 2016. The benchmark price for a detached property is $1,561,000. This represents a 3.1 per cent increase over May 2016 and a 2.9 per cent increase compared to April 2017.
Sales of apartment properties reached 2,025 in May 2017, a decrease of 5.8 per cent compared to the 2,150 sales in May 2016.The benchmark price for an apartment property is $571,300. This represents a 17.8 per cent increase over May 2016 and a 3.1 per cent increase compared to April 2017.
Attached property sales in May 2017 totalled 791, an increase of 4.9 per cent compared to the 754 sales in May 2016. The benchmark price for an attached property is $715,400. This represents a 13.1 per cent increase over May 2016 and a 1.9 per cent increase compared to April 2017.
Download the full May 2017 stats package here.
 The British Columbia Real Estate Association (BCREA) reports that a total of 9,865 residential unit sales were recorded by the Multiple Listing Service® (MLS®) in April, down 23.9 per cent from the same period last year. Total sales dollar volume was $7.19 billion, down 25.4 per cent from April 2016. The average MLS® residential price in the province was $728,955, a 2 per cent decrease from the same period last year.
“BC home sales are on an upward trend this spring, led by a sharp increase in consumer demand in the Lower Mainland,” said Cameron Muir, BCREA Chief Economist. The seasonally adjusted annual rate (SAAR) of home sales was over 106,000 units in April, significantly above the five-year SAAR for April of 89,000 units.
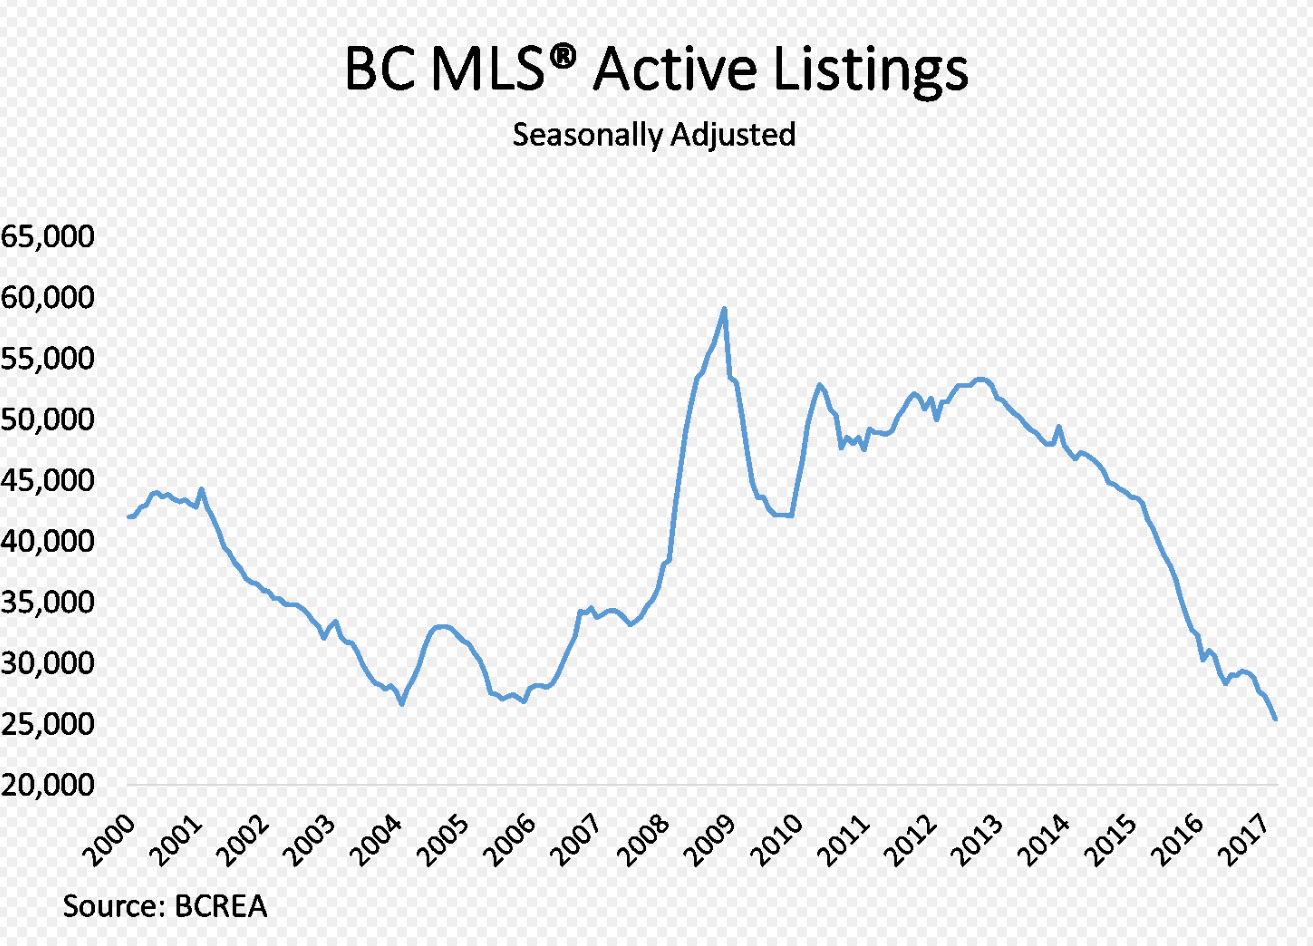
The supply of homes for sale declined 17 per cent from April 2016. On a seasonally adjusted basis, active residential listings have declined 50 per cent since 2012 and are now at their lowest level in over 20 years. The imbalance between supply and demand is continuing to drive home prices higher in most regions, further eroding affordability.
Year-to-date, BC residential sales dollar volume was down 31.8 per cent to $21.3 billion, when compared with the same period in 2016. Residential unit sales declined 25.0 per cent to 30,757 units, while the average MLS® residential price was down 9.2 per cent to $692,220.
For the complete news release, including detailed statistics, click here.
BC Real Estate Association (BCREA) Economist Brendon Ogmundson discusses the January 2016 statistics.
Homes Sales Off to a Strong Start in 2016
Vancouver, BC – Februay 12, 2016. The British Columbia Real Estate Association (BCREA) reports that a total of 5,831 residential unit sales were recorded by the Multiple Listing Service® (MLS®) last month, up 33.2 per cent from January of last year. Total sales dollar volume was $4.39 billion in January, up 69.1 per cent compared to the previous year.
The average MLS® residential price in the province was up 26.9 per cent year-over-year, to $752,906.
“The BC housing market continues to build on momentum from a very strong 2015,” said Brendon Ogmundson, BCREA Economist. “Heightened demand is being met with the lowest level of supply in a decade, resulting in increased pressure on prices in much of the province.”
The housing market has seen a blistering start to 2016, with housing demand supported by low mortgage rates and rising employment and wage growth in the province. However, MLS® residential sales are forecast to edge lower this year. Total MLS® sales last year were the third highest on record at 102,517. A record 106,310 residential unit sales were recorded in 2005, while the only other year eclipsing 2016 were 2007 when 102,805 unit sales were recorded.
Thanks to BCREA for this update
From the REBGV
Home sales in the Metro Vancouver* housing market continue to outpace long-term averages for this time of year.The Real Estate Board of Greater Vancouver (REBGV) reports that residential property sales in Greater Vancouver reached 3,057 on the Multiple Listing Service® (MLS®) in October 2014. This represents a 14.9 per cent increase compared to the 2,661 sales in October 2013, and a 4.6 per cent increase over the 2,922 sales in September 2014.
Last month’s sales were 16.6 per cent above the 10-year sales average for October.
“We’ve seen strong and consistent demand from home buyers in Metro Vancouver throughout this year. This has led to steady increases in home prices of between four and eight per cent depending on the property,” said REBGV president Ray Harris.
New listings for detached, attached and apartment properties in Metro Vancouver totalled 4,487 in October. This represents a four per cent increase compared to the 4,315 new listings in October 2013 and a 14.7 per cent decline from the 5,259 new listings in September.
The total number of properties currently listed for sale on the MLS® system in Metro Vancouver is 13,851, a 9.2 per cent decline compared to October 2013 and a 6.6 per cent decrease compared to September 2014.
The MLS® Home Price Index composite benchmark price for all residential properties in Metro Vancouver is currently $637,000. This represents a six per cent increase compared to October 2013.
“Detached homes continue to increase in price more than condominium and townhome properties. This is largely a function of supply and demand as the supply of condominium and townhome properties are more abundant than detached homes in our region,” Harris said.
Sales of detached properties in October 2014 reached 1,271, an increase of 19.1 per cent from the 1,067 detached sales recorded in October 2013, and a 60.9 per cent increase from the 790 units sold in October 2012. The benchmark price for detached properties increased 7.9 per cent from October 2013 to $995,100.
Sales of apartment properties reached 1,268 in October 2014, an increase of 15.5 per cent compared to the 1,098 sales in October 2013, and a 57.9 per cent increase compared to the 803 sales in October 2012. The benchmark price of an apartment property increased four per cent from October 2013 to $380,200.
Attached property sales in October 2014 totalled 518, a 4.4 per cent increase compared to the 496 sales in October 2013, and an 53.3 per cent increase over the 338 attached properties sold in October 2012. The benchmark price of an attached unit increased 4.7 per cent between October 2013 and 2014 to $479,500.
* Areas covered by Real Estate Board of Greater Vancouver include: Whistler, Sunshine Coast, Squamish, West Vancouver, North Vancouver, Vancouver, Burnaby, New Westminster, Richmond, Port Moody, Port Coquitlam, Coquitlam, New Westminster, Pitt Meadows, Maple Ridge, and South Delta.
Ray Harris, president, Real Estate Board of Greater Vancouver, discusses June 2014 real estate market activity in the Greater Vancouver area.
Here’s the latest from the BC Real Estate Association:
July Home Sales Highest Since 2009
Vancouver, BC August 14, 2013. The British Columbia Real Estate Association (BCREA) reports that a total of 7,650 residential sales were recorded by the Multiple Listing Service® (MLS®) in BC for July, up 18 per cent from July of 2012. Total sales dollar volume was 32.8 per cent higher than a year ago at $4.09 billion. The average MLS® residential price in the province was $534,360, up 12.5 per cent from July 2012.
“Home sales in the province posted their strongest July since 2009,” said Cameron Muir, BCREA Chief Economist. “After six consecutive months of rising consumer demand, it’s now clear that BC housing markets are recovering from tighter lending regulations introduced last year,” added Muir.
“Rising home sales are unlikely to put any significant upward pressure on home prices,” cautioned Muir,as the inventory of homes for sale is expected to keep pace with demand.Many potential home sellers that have been holding off for improved market conditions are expected to put their homes on the market to meet the swelling ranks of home buyers.
Year-to-date, BC residential sales dollar volume was down 2.8 per cent to $22.9 billion, compared to the same period last year. Residential unit sales were down 4 per cent to 42,986 units, while the average MLS® residential price was up 1.3 per cent at $531,928.
For more details see the BCREA site.
BCREA Chief Economist Cameron Muir discusses the November 2012 housing market statistics:

Greater Vancouver residential property sale and listing activity below 10-year averages in November
Over the past six months, the Greater Vancouver housing market has seen a reduction in the number of homes listed for sale, a gradual moderation in home prices and a decrease in property sales compared to historical averages.
The Real Estate Board of Greater Vancouver (REBGV) reports that residential property sales of detached, attached and apartment properties reached 1,686 on the region’s Multiple Listing Service® (MLS®) in November, a 28.6 per cent decline compared to the 2,360 sales in November 2011 and a 12.7 per cent decline compared to the 1,931 home sales in October 2012.November sales were 30.3 per cent below the 10-year November sales average of 2,420.
“Home sellers appear more inclined to remove their properties from the market today rather than lower prices to sell their properties. On the other hand, buyers appear to be expecting prices to moderate,” Eugen Klein, REBGV president said.
New listings for detached, attached and apartment properties in Greater Vancouver totalled 2,758 in November. This represents a 14.4 per cent decline compared to November 2011 when 3,222 properties were listed for sale on the MLS® and a 36.2 per cent decline compared to the 4,323 new listings in October 2012.
New listings were 12.9 per cent below the 10-year November average of 3,168.
At 15,689, the total number of residential property listings on the MLS® increased 13 per cent from this time last year and declined 9.7 per cent compared to October 2012. Total listings in the region have declined by nearly 3,000 properties since reaching a peak of 18,493 in June.
The region’s sales-to-active-listings ratio was unchanged from October at 11 per cent.
“Home prices in Greater Vancouver have generally declined between three and five and a half per cent, depending on property type, since reaching a peak six months ago,” Klein said. “Changes in home prices vary per municipality and neighbourhood. It”s good to check local market statistics with your REALTOR®”
Since reaching a peak in May of $625,100, the MLS® Home Price Index composite benchmark price for all residential properties in Greater Vancouver has declined 4.5 per cent to $596,900. This represents a 1.7 per cent decline when we compared to this time last year.
Sales of detached properties in Greater Vancouver reached 629 in November, a decrease of 31.3 per cent from the 916 detached sales recorded in November 2011, and a 40.1 per cent decrease from the 1,050 units sold in November 2010. Since reaching a peak in May, the benchmark price for a detached property in Greater Vancouver has declined 5.5 per cent to $914,500.
Sales of apartment properties reached 750 in November 2012, a 25 per cent decrease compared to the 1,000 sales in November 2011, and a decrease of 28.7 per cent compared to the 1,052 sales in November 2010. Since reaching a peak in May, the benchmark price for an apartment property in Greater Vancouver has declined 3.9 per cent to $364,900.
Attached property sales in November 2012 totalled 307, a 30.9 per cent decrease compared to the 444 sales in November 2011, and a 24.6 per cent decrease from the 407 attached properties sold in November 2010. Since reaching a peak in April, the benchmark price for an attached property in Greater Vancouver has declined 3.6 per cent to $454,300.
Feature Facts:
Of the 15,689 homes currently for sale on the MLS® in Greater Vancouver, 49.6 per cent are listed for $600,000 or less. Of those, 1,321 are detached properties, 5,039 are condominiums and 1,419 are townhomes.
Of the 1,686 homes that sold in Greater Vancouver in November, 273 (16%) sold for $1 million or more.
From the BCREA
Recent report from the Real Estate Board of Greater Vancouver:
The Greater Vancouver housing market saw a slight increase in the number of home sales, a slight reduction in the number of listings, and a slight decrease in home prices in October compared to the summer months. With those changes, the sales-to-active-listings ratio increased to 11 per cent in October from 8 per cent in September.
The Real Estate Board of Greater Vancouver (REBGV) reported 1,931 residential property sales of detached, attached and apartment properties on the region’s Multiple Listing Service® (MLS®) in October, a 16.7 per cent decline compared to the 2,317 sales in October 2011 and a 27.4 per cent increase compared to the 1,516 home sales in September 2012.
October sales were 28.5 per cent below the 10-year October sales average of 2,700.
“Buyer demand increased slightly in October compared to the previous few months,” Sandra Wyant, REBGV president-elect said. “Overall conditions in today’s market remain in favour of buyers, with low interest rates, more choice, and less time pressure in terms of decision-making. This translates into a calmer atmosphere for those looking to buy a home and it places more onus on sellers to ensure their homes are priced to compete in today’s marketplace.”
New listings for detached, attached and apartment properties in Greater Vancouver totalled 4,323 in October. This represents a 1.2 per cent decline compared to October 2011 when 4,374 properties were listed for sale on the MLS® and an 18.8 per cent decline compared to the 5,321 new listings in September 2012.
At 17,370, the total number of residential property listings on the MLS® increased 12 per cent from this time last year and declined 5.3 per cent compared to September 2012.
Since reaching a peak of $625,100 in May, the MLS Home Price Index® (MLS HPI®) composite benchmark price for all residential properties in Greater Vancouver declined 3.4 per cent to $603,800 in October. This represents a 0.8 per cent decline compared to last year.
“There’ve been modest price changes since they peaked in the spring. The largest reductions have occurred in the areas and property types that experienced the biggest price increases over the last few years,” Wyant said.
Since hitting a record high in April, the benchmark price of a detached home on the Westside of Vancouver has declined 8.6 per cent while detached homes in Richmond and West Vancouver have seen declines of 6 per cent over the same time period.
Sales of detached properties in Greater Vancouver reached 790 in October, a decrease of 18.9 per cent from the 974 detached sales recorded in October 2011, and a 19.1 per cent decrease from the 976 units sold in October 2010. Since reaching a peak in May, the benchmark price for a detached property in Greater Vancouver has declined 4.1 per cent to $927,500.
Sales of apartment properties reached 803 in October 2012, a 16.2 per cent decrease compared to the 958 sales in October 2011, and a decrease of 18.4 per cent compared to the 984 sales in October 2010. Since reaching a peak in May, the benchmark price for an apartment property in Greater Vancouver has declined 2.9 per cent to $368,800.
Attached property sales in October 2012 totalled 338, an 11.5 per cent decrease compared to the 382 sales in October 2011, and a 10.3 per cent decrease from the 377 attached properties sold in October 2010. Since reaching a peak in April, the benchmark price for an attached property in Greater Vancouver has declined 2.9 per cent to $457,700.
Full details here.