watch: Housing Market Update (July 2017) 


BC Real Estate Association (BCREA) Economist Brendon Ogmundson discusses the June 2017 statistics.
BC Real Estate Association (BCREA) Economist Brendon Ogmundson discusses the June 2017 statistics.
watch: BCREA Chief Economist Cameron Muir discuss the May 2017 statistics
Home buyer activity returned to near record levels across the Metro Vancouver housing market in May.
Residential property sales in the region totalled 4,364 in May 2017, a decrease of 8.5 per cent from the 4,769 sales in May 2016, an all-time record, and an increase of 22.8 per cent compared to April 2017 when 3,553 homes sold.
Last month’s sales were 23.7 per cent above the 10-year May sales average and is the third-highest selling May on record.
“Demand for condominiums and townhomes is driving today’s activity,” Jill Oudil, Real Estate Board of Greater Vancouver (REBGV) president said. “First-time buyers and people looking to downsize from their single-family homes are both competing for these two types of housing.”
New listings for detached, attached and apartment properties in Metro Vancouver totalled 6,044 in May 2017. This represents a 3.9 per cent decrease compared to the 6,289 units listed in May 2016 and a 23.2 per cent increase compared to April 2017 when 4,907 homes were listed.
The month-over-month increase in new listings was led by detached homes at 27.1 per cent, followed by apartments at 22.7 per cent and townhomes at 14.1 per cent.
The total number of properties currently listed for sale on the MLS® system in Metro Vancouver is 8,168, a 5.7 per cent increase compared to May 2016 (7,726) and a 4.5 per cent increase compared to April 2017 (7,813).
“Home buyers are beginning to have more selection to choose from in the detached market, but the number of condominiums for sale continues to decline,” Oudil said.
The sales-to-active listings ratio across all residential categories is 53.4 per cent. By property type, the ratio is 31 per cent for detached homes, 76.1 per cent for townhomes, and 94.6 per cent for condominiums.
Generally, analysts say that downward pressure on home prices occurs when the ratio dips below the 12 per cent mark for a sustained period, while home prices often experience upward pressure when it surpasses 20 per cent over several months.
“While sales are inching closer to the record-breaking pace of 2016, the market itself looks different. Sales last year were driven by demand for single-family homes. This year, it’s clear that townhomes and condominiums are leading the way,” said Oudil. “It’s important to work with your local REALTOR® to understand the different factors affecting the market today.”
The MLS® Home Price Index composite benchmark price for all residential properties in Metro Vancouver is currently $967,500. This represents an 8.8 per cent increase over May 2016 and a 2.8 per cent increase compared to April 2017.
Sales of detached properties in May 2017 reached 1,548, a decrease of 17 per cent from the 1,865 detached sales recorded in May 2016. The benchmark price for a detached property is $1,561,000. This represents a 3.1 per cent increase over May 2016 and a 2.9 per cent increase compared to April 2017.
Sales of apartment properties reached 2,025 in May 2017, a decrease of 5.8 per cent compared to the 2,150 sales in May 2016.The benchmark price for an apartment property is $571,300. This represents a 17.8 per cent increase over May 2016 and a 3.1 per cent increase compared to April 2017.
Attached property sales in May 2017 totalled 791, an increase of 4.9 per cent compared to the 754 sales in May 2016. The benchmark price for an attached property is $715,400. This represents a 13.1 per cent increase over May 2016 and a 1.9 per cent increase compared to April 2017.
Download the full May 2017 stats package here.
Last month’s sales were 28.1 per cent above the 10-year sales average for the month and rank as the highest selling June on record. REBGV President Dan Morrison gives a quick summary of June housing events.
An overview of the housing statistics for October 2015 in the Greater Vancouver area. Also, REBGV President Darcy McLeod discusses elevated home sale trends.
Here’s the latest news release from (BCREA) British Columbia Real Estate Association:
Vancouver, BC – December 12, 2014. The British Columbia Real Estate Association (BCREA)
reports that a total of 5,972 residential unit sales were recorded by the Multiple Listing Service®
(MLS®) in November, up 8.8 per cent from November 2013. Total sales dollar volume was $3.4
illion, an increase of 12.1 per cent compared to a year ago. The average MLS® residential price
in the province rose to $574,694, up 3.1 per cent from the same month last year.
“BC home sales were robust in November,” said Cameron Muir, BCREA Chief Economist. “Improving economic conditions, strong consumer confidence and persistently low mortgage interest rates are providing a solid foundation for elevated consumer demand.”
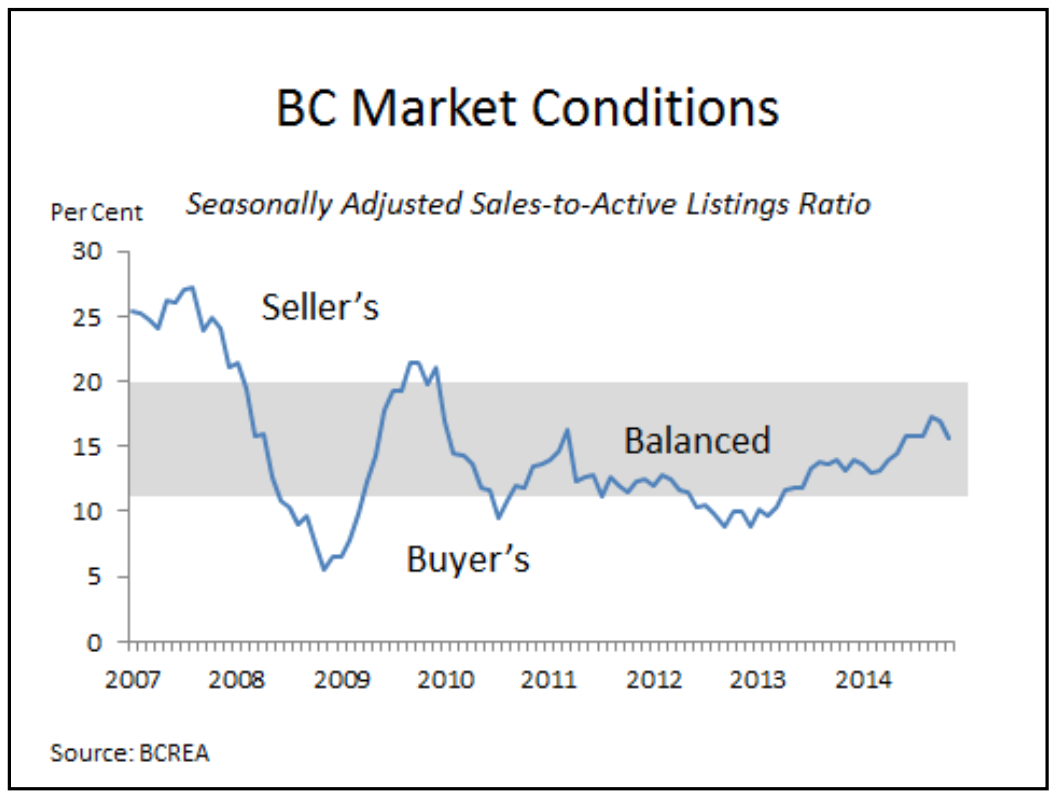
“Market conditions have improved province wide, with most regional markets now in the mid to high range of a balanced market,” added Muir.
Year-to-date, BC residential sales dollar volume was up 22.1 per cent to $44.8 billion, compared to the same period last year. Residential unit sales were up 15.3 per cent to 78,973 units, while the average MLS® residential price was up 6.0 per cent at $567,292.
Link HERE for more details.
As Members of the BCREA, we are grateful for their ongoing reports and statistics keeping us up to date while tracking the Vancouver Real Estate Market.
* * *
Housing Demand Ratchets Higher in British Columbia
Vancouver, BC – November 18, 2014. The British Columbia Real Estate Association (BCREA) released its 2014 Fourth Quarter Housing Forecast today.
“Consumer demand has ratcheted up this year and is expected to remain at a more elevated level through 2015,” said Cameron Muir, BCREA Chief Economist. “While historically low mortgage rates support demand, the housing market is also being underpinned by a more robust economy and associated job growth, strong net migration and consumer confidence.”
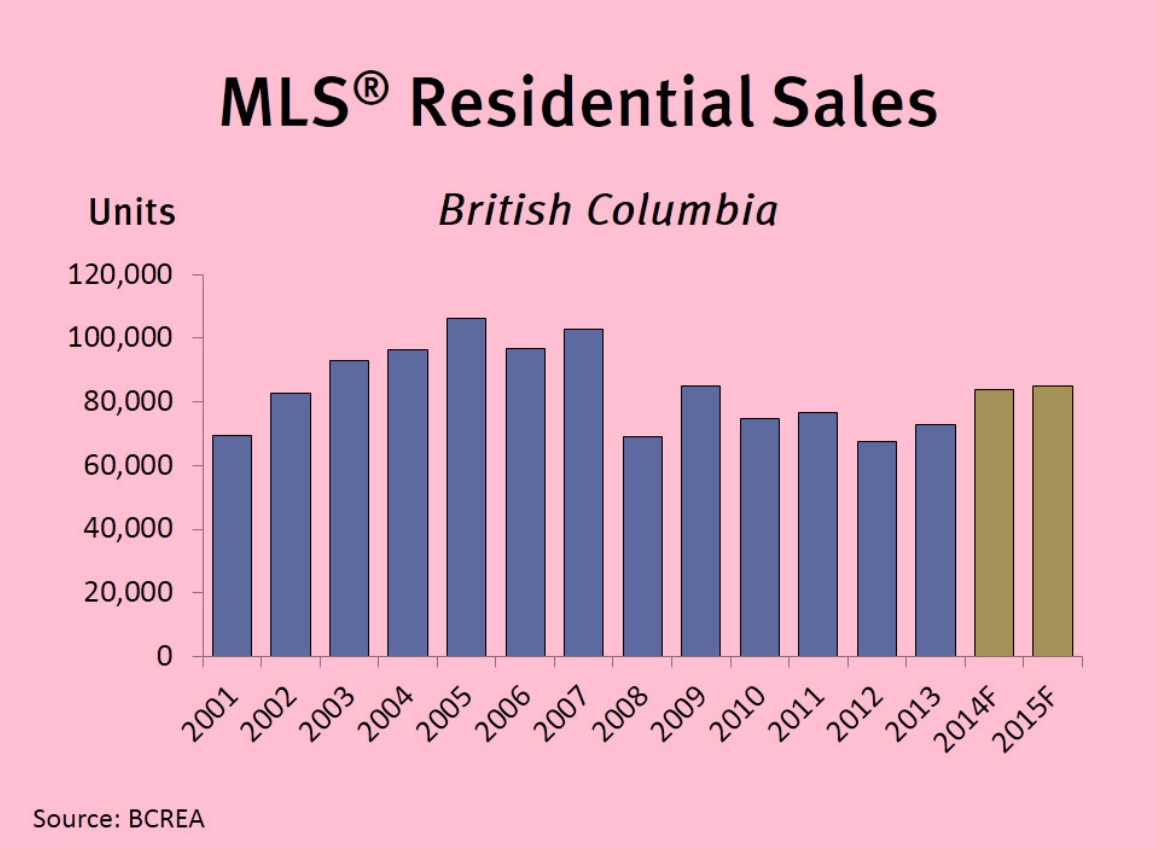
BC Multiple Listing Service® (MLS®) residential sales are forecast to increase 15.1 per cent to 83,900 units this year. Stronger economic conditions are expected to be somewhat offset by higher interest rates later next year, and keep home sales from advancing much further. As a result, MLS® residential sales are forecast to edge up a further 1.2 per cent to 84,900 units in 2015. The 15-year average is 80,400 unit sales and a record 106,300 MLS® residential sales were recorded in 2005.
The average MLS® residential price for the province is forecast to increase 6 per cent to a record $569,800 this year and a further 1.2 per cent to $574,300 in 2015. “New construction activity is generally keeping pace with population and household growth, keeping supply in line with consumer demand,” added Muir. BC housing starts are forecast to increase 4.6 per cent to 28,300 units this year and a further 1.4 per cent to 28,700 units in 2015.
For full details http://www.bcrea.bc.ca/docs/economics-forecasts-and-presentations/housingforecast.pdf
From the REBGV
Home sales in the Metro Vancouver* housing market continue to outpace long-term averages for this time of year.The Real Estate Board of Greater Vancouver (REBGV) reports that residential property sales in Greater Vancouver reached 3,057 on the Multiple Listing Service® (MLS®) in October 2014. This represents a 14.9 per cent increase compared to the 2,661 sales in October 2013, and a 4.6 per cent increase over the 2,922 sales in September 2014.
Last month’s sales were 16.6 per cent above the 10-year sales average for October.
“We’ve seen strong and consistent demand from home buyers in Metro Vancouver throughout this year. This has led to steady increases in home prices of between four and eight per cent depending on the property,” said REBGV president Ray Harris.
New listings for detached, attached and apartment properties in Metro Vancouver totalled 4,487 in October. This represents a four per cent increase compared to the 4,315 new listings in October 2013 and a 14.7 per cent decline from the 5,259 new listings in September.
The total number of properties currently listed for sale on the MLS® system in Metro Vancouver is 13,851, a 9.2 per cent decline compared to October 2013 and a 6.6 per cent decrease compared to September 2014.
The MLS® Home Price Index composite benchmark price for all residential properties in Metro Vancouver is currently $637,000. This represents a six per cent increase compared to October 2013.
“Detached homes continue to increase in price more than condominium and townhome properties. This is largely a function of supply and demand as the supply of condominium and townhome properties are more abundant than detached homes in our region,” Harris said.
Sales of detached properties in October 2014 reached 1,271, an increase of 19.1 per cent from the 1,067 detached sales recorded in October 2013, and a 60.9 per cent increase from the 790 units sold in October 2012. The benchmark price for detached properties increased 7.9 per cent from October 2013 to $995,100.
Sales of apartment properties reached 1,268 in October 2014, an increase of 15.5 per cent compared to the 1,098 sales in October 2013, and a 57.9 per cent increase compared to the 803 sales in October 2012. The benchmark price of an apartment property increased four per cent from October 2013 to $380,200.
Attached property sales in October 2014 totalled 518, a 4.4 per cent increase compared to the 496 sales in October 2013, and an 53.3 per cent increase over the 338 attached properties sold in October 2012. The benchmark price of an attached unit increased 4.7 per cent between October 2013 and 2014 to $479,500.
* Areas covered by Real Estate Board of Greater Vancouver include: Whistler, Sunshine Coast, Squamish, West Vancouver, North Vancouver, Vancouver, Burnaby, New Westminster, Richmond, Port Moody, Port Coquitlam, Coquitlam, New Westminster, Pitt Meadows, Maple Ridge, and South Delta.
 Here is a report on the latest stats from the Real Estate Board of Greater Vancouver (REBGV)
Consistent home sale and listing activity has allowed balanced market conditions to prevail in the Greater Vancouver housing market for most of 2013.
The Real Estate Board of Greater Vancouver (REBGV) reports that residential property sales in Greater Vancouver reached 2,321 on the Multiple Listing Service® (MLS®) in November 2013. This represents a 37.7 per cent increase compared to the 1,686 sales recorded in November 2012, and a 12.8 per cent decline compared to the 2,661 sales in October 2013.
Last month’s sales were 1.2 per cent below the 10-year sales average for the month, while new listings were 1.5 per cent above the 10-year November average.
We’ve seen steady and consistent trends the Greater Vancouver housing market for much of this year,Sandra Wyant, REBGV president said. This year’s activity has resulted in gradual and modest increases in home prices of approximately one per cent over the last 12 months in the region.
New listings for detached, attached and apartment properties in Greater Vancouver totalled 3,245 in November. This represents a 17.7 per cent increase compared to the 2,758 new listings reported in November 2012 and a 24.8 per cent decline compared to the 4,315 new listings in October of this year.
The total number of properties currently listed for sale on the MLS® in Greater Vancouver is 13,986, a 10.9 per cent decrease compared to November 2012 and an 8.3 per cent decline compared to October 2013.
The sales-to-active-listings ratio currently sits at 16.6 per cent in Greater Vancouver.
The MLS® Home Price Index composite benchmark price for all residential properties in Greater Vancouver is currently $603,000. This represents a 1 per cent increase compared to November 2012.
Sales of detached properties reached 926 in November 2013, an increase of 47.2 per cent from the 629 detached sales recorded in November 2012, and a 1.1 per cent increase from the 916 units sold in November 2011. The benchmark price for detached properties increased 1.1 per cent from November 2012 to $924,800.
Sales of apartment properties reached 969 in November 2013, an increase of 29.2 per cent compared to the 750 sales in November 2012, and a decline of 3.1 per cent compared to the 1,000 sales in November 2011. The benchmark price of an apartment property increased 0.8 per cent from November 2012 to $367,800.
Attached property sales in November 2013 totalled 426, an increase of 38.8 per cent compared to the 307 sales in November 2012, and a 4.1 per cent decline compared to the 444 attached properties sold in November 2011. The benchmark price of an attached unit is currently $458,000, which is a 0.8 per cent increase from November 2012.
Find out more HERE

Greater Vancouver residential property sale and listing activity below 10-year averages in November
Over the past six months, the Greater Vancouver housing market has seen a reduction in the number of homes listed for sale, a gradual moderation in home prices and a decrease in property sales compared to historical averages.
The Real Estate Board of Greater Vancouver (REBGV) reports that residential property sales of detached, attached and apartment properties reached 1,686 on the region’s Multiple Listing Service® (MLS®) in November, a 28.6 per cent decline compared to the 2,360 sales in November 2011 and a 12.7 per cent decline compared to the 1,931 home sales in October 2012.November sales were 30.3 per cent below the 10-year November sales average of 2,420.
“Home sellers appear more inclined to remove their properties from the market today rather than lower prices to sell their properties. On the other hand, buyers appear to be expecting prices to moderate,” Eugen Klein, REBGV president said.
New listings for detached, attached and apartment properties in Greater Vancouver totalled 2,758 in November. This represents a 14.4 per cent decline compared to November 2011 when 3,222 properties were listed for sale on the MLS® and a 36.2 per cent decline compared to the 4,323 new listings in October 2012.
New listings were 12.9 per cent below the 10-year November average of 3,168.
At 15,689, the total number of residential property listings on the MLS® increased 13 per cent from this time last year and declined 9.7 per cent compared to October 2012. Total listings in the region have declined by nearly 3,000 properties since reaching a peak of 18,493 in June.
The region’s sales-to-active-listings ratio was unchanged from October at 11 per cent.
“Home prices in Greater Vancouver have generally declined between three and five and a half per cent, depending on property type, since reaching a peak six months ago,” Klein said. “Changes in home prices vary per municipality and neighbourhood. It”s good to check local market statistics with your REALTOR®”
Since reaching a peak in May of $625,100, the MLS® Home Price Index composite benchmark price for all residential properties in Greater Vancouver has declined 4.5 per cent to $596,900. This represents a 1.7 per cent decline when we compared to this time last year.
Sales of detached properties in Greater Vancouver reached 629 in November, a decrease of 31.3 per cent from the 916 detached sales recorded in November 2011, and a 40.1 per cent decrease from the 1,050 units sold in November 2010. Since reaching a peak in May, the benchmark price for a detached property in Greater Vancouver has declined 5.5 per cent to $914,500.
Sales of apartment properties reached 750 in November 2012, a 25 per cent decrease compared to the 1,000 sales in November 2011, and a decrease of 28.7 per cent compared to the 1,052 sales in November 2010. Since reaching a peak in May, the benchmark price for an apartment property in Greater Vancouver has declined 3.9 per cent to $364,900.
Attached property sales in November 2012 totalled 307, a 30.9 per cent decrease compared to the 444 sales in November 2011, and a 24.6 per cent decrease from the 407 attached properties sold in November 2010. Since reaching a peak in April, the benchmark price for an attached property in Greater Vancouver has declined 3.6 per cent to $454,300.
Feature Facts:
Of the 15,689 homes currently for sale on the MLS® in Greater Vancouver, 49.6 per cent are listed for $600,000 or less. Of those, 1,321 are detached properties, 5,039 are condominiums and 1,419 are townhomes.
Of the 1,686 homes that sold in Greater Vancouver in November, 273 (16%) sold for $1 million or more.
From the BCREA